Ever wonder what happens after you take a paid survey? When most people think about market research, they focus on the final results. Business decisions like strategy, packaging choices, product placement, flavor preferences, price points, etc, all hang in the balance and companies pay top dollar to ask consumers what they think and feel. But long before a single finding appears in a report, an enormous amount of operational data is generated behind the scenes. Every invitation sent, qualification check completed, survey started, abandoned questionnaire, fraud detection event, and completed interview leaves a digital footprint. In this article, we will pull back the curtain on what actually goes into a study.
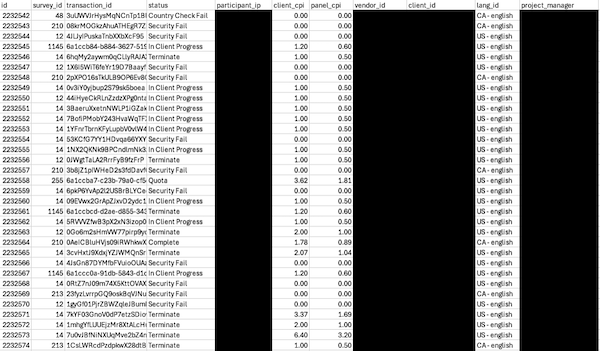
The logfile shown above is a detailed record of survey activity. Covering approximately 100,000 respondent interactions collected during June and July 2025, it provides a transparent view into how modern survey operations actually work. The dataset captures the full respondent lifecycle, from recruitment and screening to completion, termination, quality verification, and billing. Examining these records reveals the infrastructure that supports reliable market research: the systems, safeguards, and accountability mechanisms that ensure every response can be traced, validated, and ultimately trusted.
An Audit Trail of Every Respondent Interaction
Each row documents a single participant's journey through a survey, from initial contact through completion or termination. For Paidvine, this logfile functions as both a quality assurance document and the authoritative source for billing, making data accuracy and completeness essential to business operations. This is because our clients only pay us for completed surveys.
Unique Identification at Every Level
The structure includes multiple layers of identification to ensure full traceability and accountability. A unique respondent ID anchors each record, while a transaction ID creates a cryptographic fingerprint of the complete participant session. We encode information about respondent source, geographic origin, survey version, device ID, etc. This redundancy prevents billing disputes and enables rapid investigation if questions arise about specific responses.
Timestamp Precision for Operational Transparency
Time is money, literally. Every respondent interaction is recorded down to the second, providing granular visibility into survey flow, capacity bottlenecks, and respondent behavior. These timestamps might seem like overkill, but they enable analysis of completion rates, dropout timing, and the velocity of responses across different hours of the day. For clients questioning data quality or timing patterns, the timestamps provide objective evidence of when surveys were taken and how long respondents spent in various stages. This precision also helps identify suspicious patterns indicative of low-quality responses (“speed-clicking”) or automated participation attempts (bots).
Status Tracking Reveals Operational Complexity
It’s not enough to sign-up and click. Completion is key. And so we divide our survey participation outcomes into over a dozen distinct categories, ranging from successful completions to multiple failure and termination scenarios. "Complete" responses generate billable revenue and represent our core business outcome. "In Client Progress" indicates respondents actively working through a survey, while "In Screeners" tracks those still being qualified before entering the main questionnaire. “Terminations” occur when respondents don’t qualify for a study, while specialized failure categories capture security incidents, fraud attempts, quota exhaustion, and geography/eligibility mismatches. This taxonomy allows our clients to understand not just success rates, but the specific reasons behind participant attrition.
Cost-Per-Interview Pricing and Billing Accuracy
CPI figures vary by survey difficulty, respondent quality requirements, and market conditions. Only completed surveys generate billable revenue, though the logfile captures both costs associated with attempted completions and cases where participants drop out midway. This granular costing allows clients to calculate their actual spend per usable response, accounting for waste from terminations and failed screeners.
Quality Control Through Multi-Stage Filtering
The categorized failure states is our commitment to respondent quality. Paidvine centers its marketing around trust on both sides of the transaction and we take it seriously. Security failures capture fraud detection and suspicious behavior patterns, while country checks ensure geographic compliance with survey requirements. Screener failures represent respondents who failed qualifying questions. Fraud flagging directly protects client data integrity by identifying and marking responses from non-authentic participants. The existence of these quality gates demonstrates that survey outcomes reflect genuine respondent participation, not artificially inflated completion counts from low-effort respondents. The battle against these quality concerns is ongoing and always a paramount concern in how we do business.
Vendor and Client Relationships in the Data
The logfile clearly tracks both the supply side and demand side of survey operations. Vendor information shows where respondents originated. Client IDs indicate which research organizations commissioned each survey, while project manager names provide human accountability and a point of contact for issues. This dual-source transparency means clients can verify that their surveys reached genuine respondents rather than relying solely on the completion data we provide. In other words, we show our work.
Geographic and Language Scope
Language designation appears in each record. This standardization supports both data quality (by ensuring respondents actually understood the questionnaire) and project scope tracking (confirming surveys were delivered to their intended markets). IP address logging provides an additional geographic check and helps our fraud detection stack (Verisoul , Stripe) identify impossible or suspicious respondent patterns, such as geolocation mismatches or responses from data center IP ranges commonly associated with automation attempts.
Volume and Coverage for Campaign Planning
In our example, 100k records provide sufficient scale to draw reliable inferences about survey delivery performance, completion rates, and quality metrics. This volume allows clients to benchmark their studies against comparable projects and understand expected cost-to-complete ratios. For us, the dataset demonstrates the throughput capacity across different survey types and difficulty levels, informing resource allocation and capacity planning. We have a team of analysts who prioritize their work based on the complexity of each study. The range of survey IDs captured indicates concurrent execution of multiple research programs, each tracked independently.
Transparency as Competitive Advantage
So why do all this if all a customer needs is the final analysis? Because it’s good business. Sharing these deep levels of operational detail demonstrates our confidence in both data quality and operational integrity. Rather than obscuring the messy reality of respondent recruitment and filtering, documenting every contact, termination, fraud flag, and cost center provides our clients with the evidence they need to trust our results. This logfile model transforms survey delivery from a black-box service into an auditable, transparent supply chain where every dollar spent and every respondent included can be accounted for and justified.
Final Thoughts
In the end, professional survey research is far more than collecting answers from people. Behind every completed interview is a complex operational process involving respondent sourcing, qualification, fraud prevention, status monitoring, cost management, and detailed audit tracking. For clients, this level of visibility provides confidence that research outcomes are built on verifiable processes rather than opaque reporting. For Paidvine, it creates the foundation for quality assurance, financial accuracy, and continuous improvement. Most importantly, the dataset shows that transparency is not just a reporting feature; it is an operational discipline. By maintaining a complete audit trail of every survey interaction, we can demonstrate exactly how results were obtained, why respondents were included or excluded, and how every completed response contributes to trustworthy, defensible insights.
About the Author: Sean Stanley is a writer and technologist with experience in healthcare, academia, and start-ups. He currently serves as Director of Operations for Survey Sherpa/Paidvine, a market research firm based in Charleston, South Carolina.